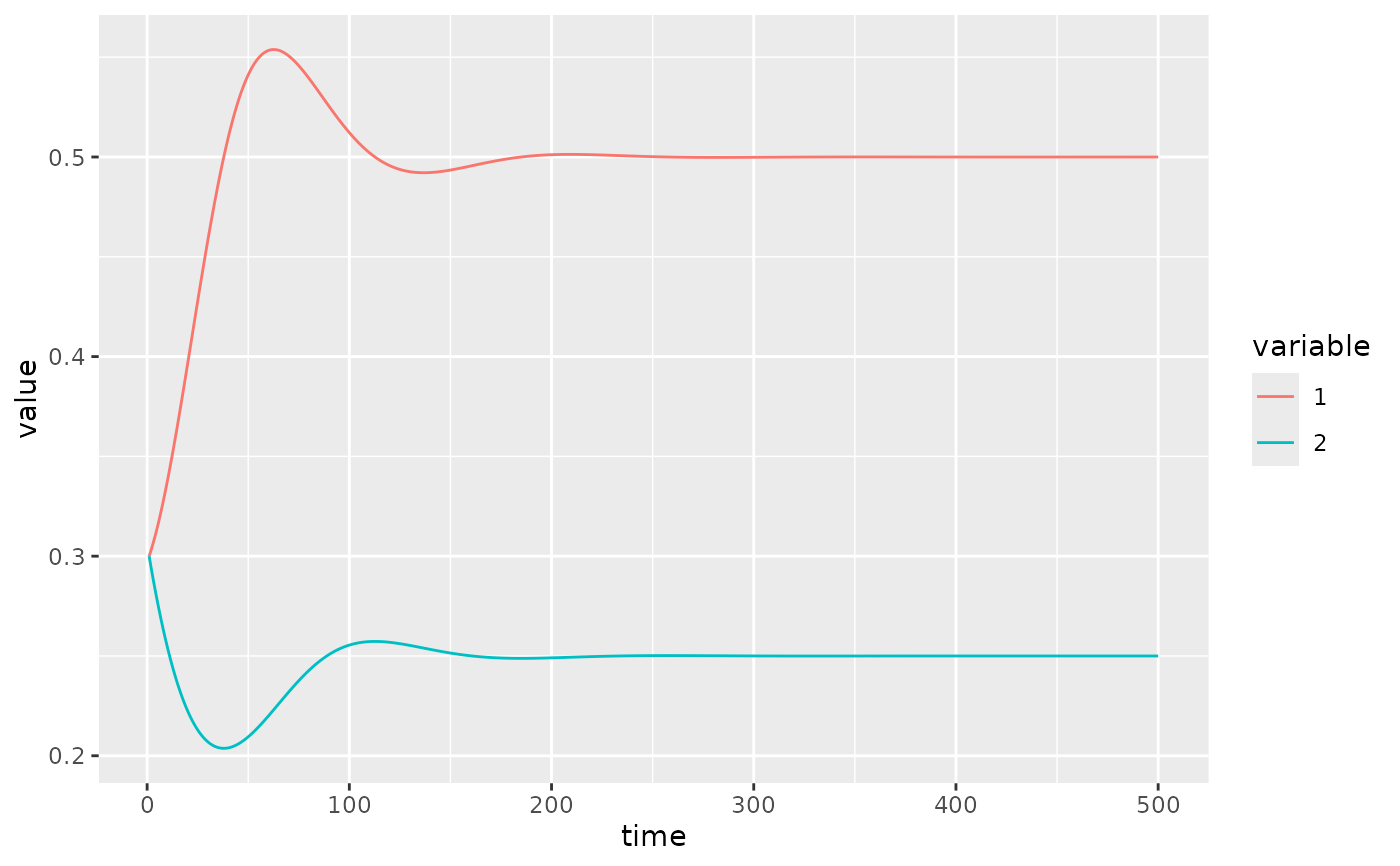
Simple ODE plot
fw_ode_plot.RdSimple ODE plot
Usage
fw_ode_plot(x, init, times)

fw_range_plot(y, show_points = FALSE, show_lev = TRUE)

fw_range_compare_plot(y, prob = 0.25, show_lev = TRUE)
Arguments
- x
an object of class
fw_model.- init
initial values (see
deSolve::ode()).- times
time steps (see
deSolve::ode()).- y
an object of class
fw_predict.- show_points
a logical. Should points be added on top of box. Note that points will be colored according to the value of the leading eigen vector.
- show_lev
a logical. Should the distribution of eigen values be included?
- prob
the quantile used to split parameters sets.
Examples
fw_ode_plot(fw_example_2species(), rep(0.3, 2), seq(1, 500, 0.1))